Background
Recently, we've decided to get more insight into the performance of several of kununu's web pages. To do this we picked Lighthouse from Google as it seems to be the most stable tool out there.
Lighthouse by default, is integrated in Google Chrome devtools. However, for our purpose we would have to use its standalone version, so we could host on multiple AWS instances. This would provide us with more accurate performance insights since those instances are bound to different geolocations.

The specifications for the meaningful analysis:
- Given list of 40+ urls that need to be tested.
- Running selected performace audit on each of the URLs from the list every hour.
- After each URL has been tested, store array of results into Google Big Query.
- Visualize resulted timeseries in Tableau
How does it work ?
Define list of URLS to be tested:
[
    {
        url: "https://engage.kununu.com/de/",
        type: "Blog HP"
    },
    {
        url: "https://engage.kununu.com/de/blog/",
        type: "Blog Article"
    },
    {
        url: "https://www.kununu.com/us/salary/share",
        type: "Salary Collection"
    },
    ...
]
Lighthouse self:
In general Lighthouse is a well documented tool, so we will only cover interesting aspects in the scope of this project
Lighthouse options:
We are only interested in performance, and particulary only in 7 specific audits:
- speed-index: Page load performance metric that shows you how quickly the contents of a page are visibly populated, the lower the score, the better.
- first-contentful-paint: Measures the time from navigation to the time when the browser renders the first bit of content from the DOM.
- time-to-first-byte: Measures of how long it takes the first bits to reach the browser from the initial request to the server.
- interactive: Measures how long it takes a page to become interactive.
- estimated-input-latency: Time for app to respond to user input.
- network-requests: Reducing the total size of network requests speeds up page load time.
const options = {
    chromeFlags: [
        '--headless',
        '--no-sandbox',
        '--disable-gpu',
    ],
    logLevel: 'error',
    onlyCategories: ['performance'],
    onlyAudits: [
        'speed-index',
        'first-contentful-paint',
        'first-meaningful-paint',
        'time-to-first-byte',
        'interactive',
        'estimated-input-latency',
        'network-requests'
    ],
    throttling: false,
    maxWaitForLoad: 10000,
};
Lighthouse invocation:
const lighthouse = require('lighthouse');
const chromeLauncher = require('chrome-launcher');

const lighthouseTest = (url, config = null) => {
    return chromeLauncher.launch({
        chromeFlags: options.chromeFlags
    })
    .then(chrome => {
        options.port = chrome.port;
        return lighthouse(url, options, config)
            .then(results => {
                return chrome.kill()
                    .then(() => results.lhr)
                    .catch(err => console.log('lighthouse error: ', err))
            })
    })
    .catch((err) => {
        console.log('chromedriver error: ', err);
    });
}
Run lighthouse with given options on each of URL's in array:
Create array of lighthouse audits for each given URL
const funcs = urls.map(linkData => () => lighthouse(linkData));We have chainPromises utility so that we run tests sequentially:
const chainPromises = funcs =>
    funcs.reduce((promise, func) =>
    promise.then(result => func().then(Array.prototype.concat.bind(result))),
    Promise.resolve([]));
And run each test after another using this chainPromises utility:
const serialRunner = () => {
    const funcs = urls.map(linkData => () => lighthouse(linkData));

    chainPromises(funcs)
    .then(result => bigQuery.bigPost(result))
    .catch(err => console.log('error serial running tests: ', err));
}
Use cron or nodescheduler to trigger test runs every x-minutes
here is how node-schedule npm package would work:
schedule.scheduleJob(`*/${scheduleInterval} * * * *`, () => {
    // run your lighthouse tests
});
Results:
Received output is a json array of lighthouse results that we store into Big Query, looking like:
[
{
"Timestamp": "2019-07-12T16:19:56.050Z",
"Source": "AWS US",
"Type": "Salary Collection",
"URL": "https://www.kununu.com/us/salary/share",
"KPIname": "FirstMeaningfulPaint",
"KPIvalue": "910.06",
"ThrottlingType": "None"
},
{
"Timestamp": "2019-07-12T16:19:56.050Z",
"Source": "AWS US",
"Type": "Salary Collection",
"URL": "https://www.kununu.com/us/salary/share",
"KPIname": "TimeToFirstBite",
"KPIvalue": "436.88",
"ThrottlingType": "None"
},
{
"Timestamp": "2019-07-12T16:19:56.050Z",
"Source": "AWS US",
"Type": "Salary Collection",
"URL": "https://www.kununu.com/us/salary/share",
"KPIname": "TimeToInteractive",
"KPIvalue": "2849.25",
"ThrottlingType": "None"
},
{
"Timestamp": "2019-07-12T16:19:56.050Z",
"Source": "AWS US",
"Type": "Salary Collection",
"URL": "https://www.kununu.com/us/salary/share",
"KPIname": "EstimatedInputLatency",
"KPIvalue": "33.32",
"ThrottlingType": "None"
},
{
"Timestamp": "2019-07-12T16:19:56.050Z",
"Source": "AWS US",
"Type": "Salary Collection",
"URL": "https://www.kununu.com/us/salary/share",
"KPIname": "NetworkRequests",
"KPIvalue": "42.00",
"ThrottlingType": "None"
}
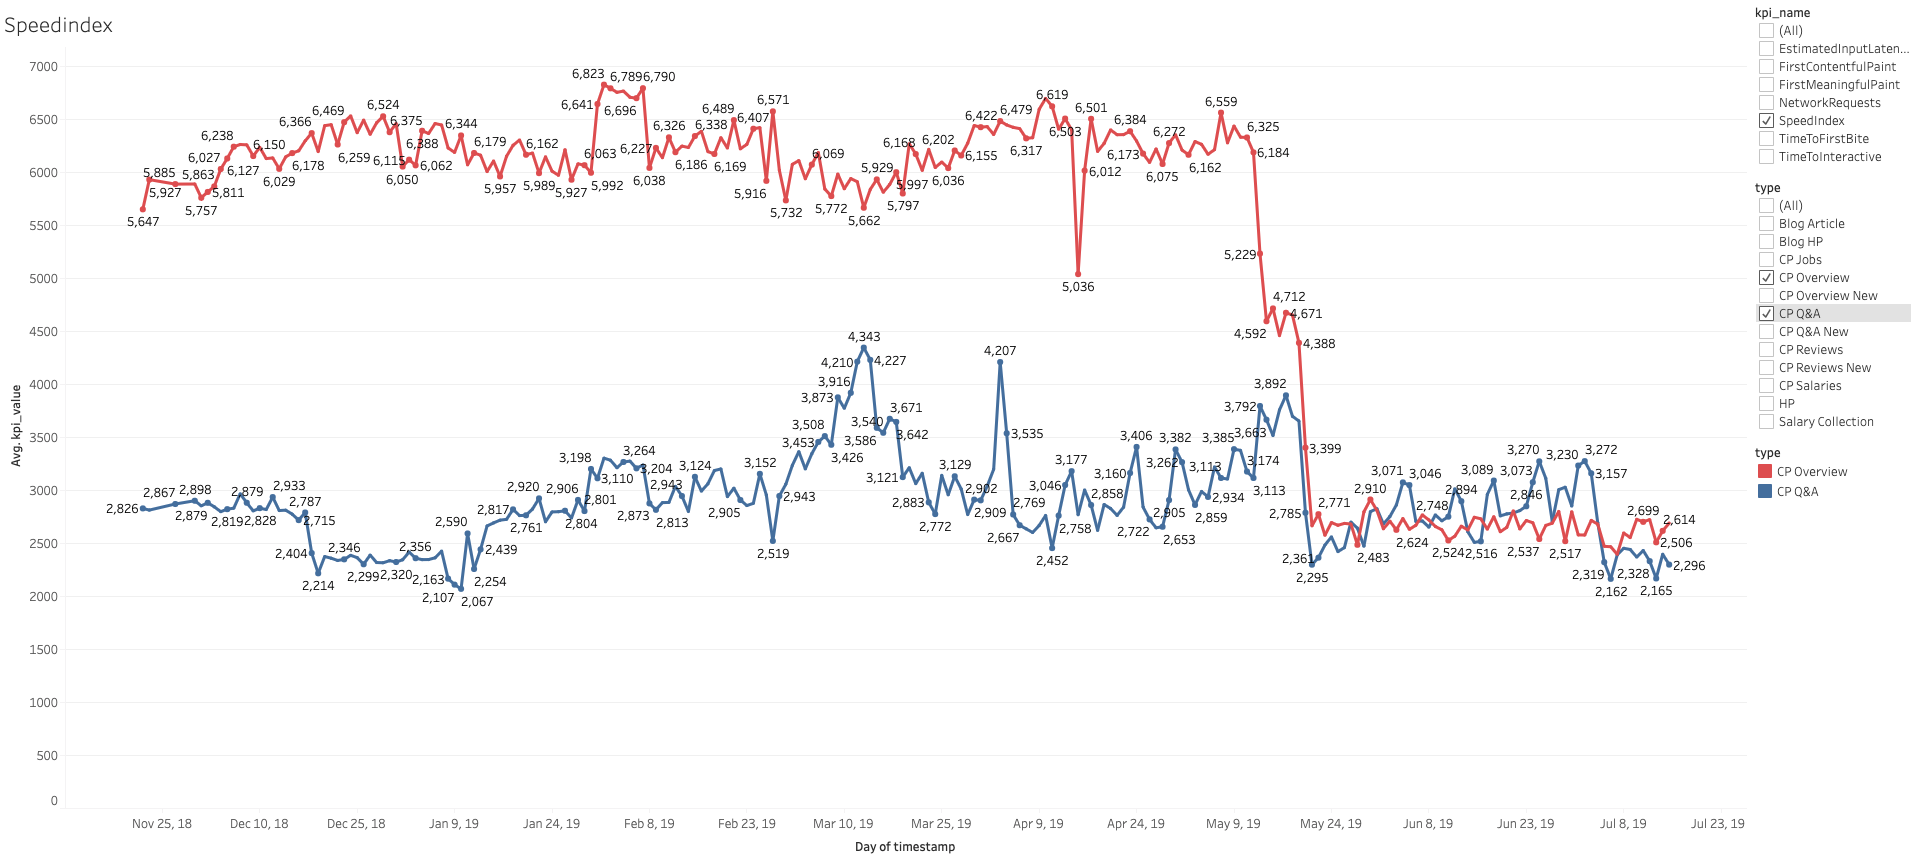
]This data can then be used to create charts which stakeholders can use to evaluate performace of web application over time. Here we see a sample chart where we compare the speedindex of two web pages over time: